Analyser
Understand your results in minutes
Upload the official IB results files directly to Analyser and explore your cohort headlines and detailed analysis instantly. Share beautifully presented results to leadership teams within minutes.
Available on the Analyser and all features plans.
Analyser at a glance
English narration · Subtitles always on
From results document to insight
The IB results PDFs are all you need
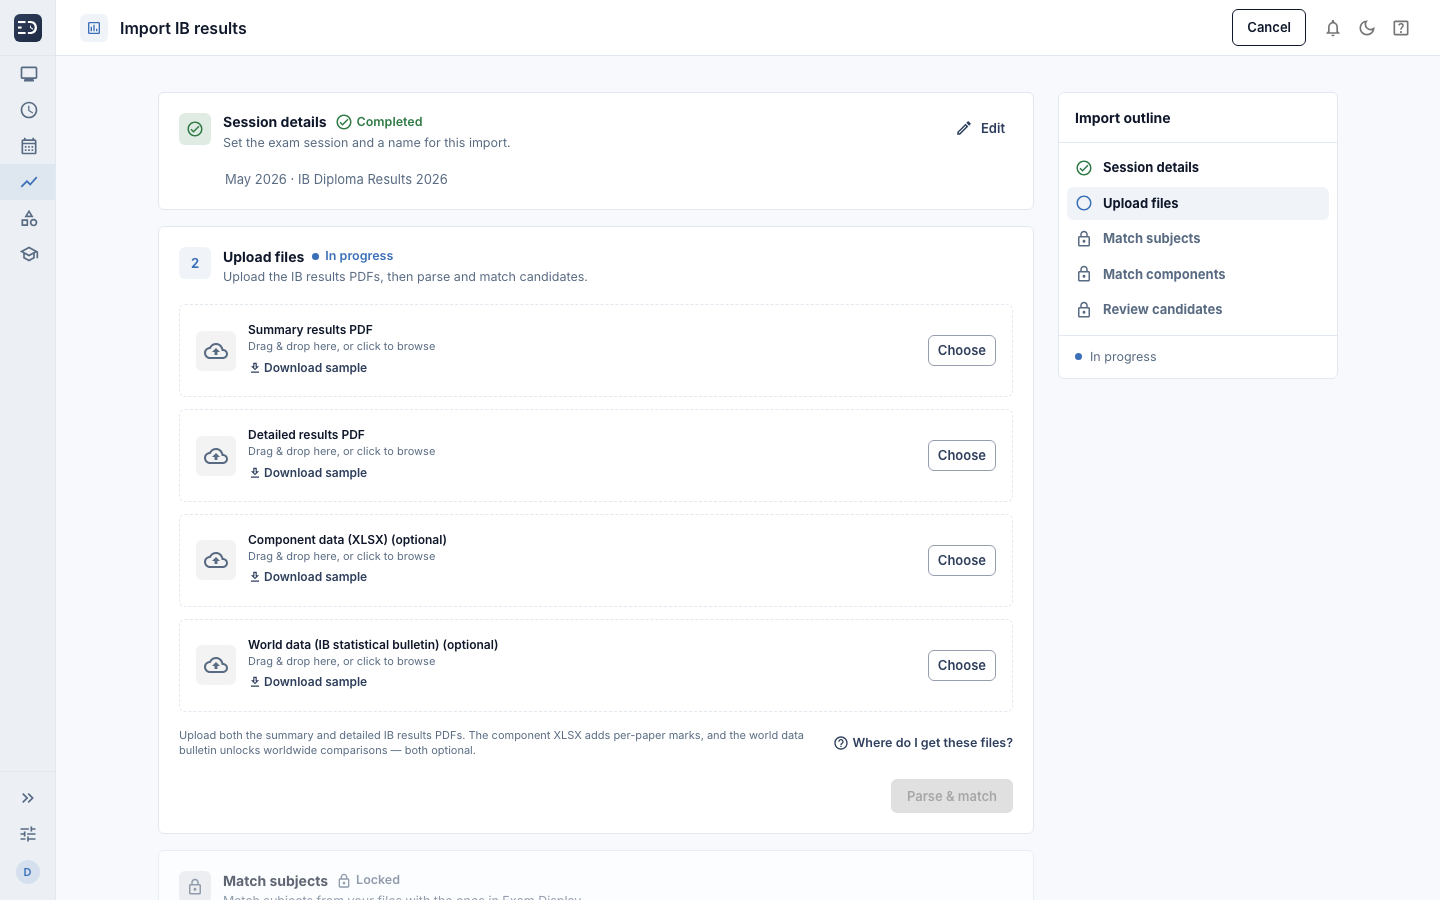
No more copying data from PDFs into spreadsheets on the day of results. Upload the PDFs to your device and Analyser will do the rest. Your data is kept confidential on your device unless you choose otherwise.
Official IB results PDFs read automatically
Subjects, components, Higher Level and Standard Level recognized automatically
Re-marks and grade changes tracked against the original results
Import
The cohort at a glance
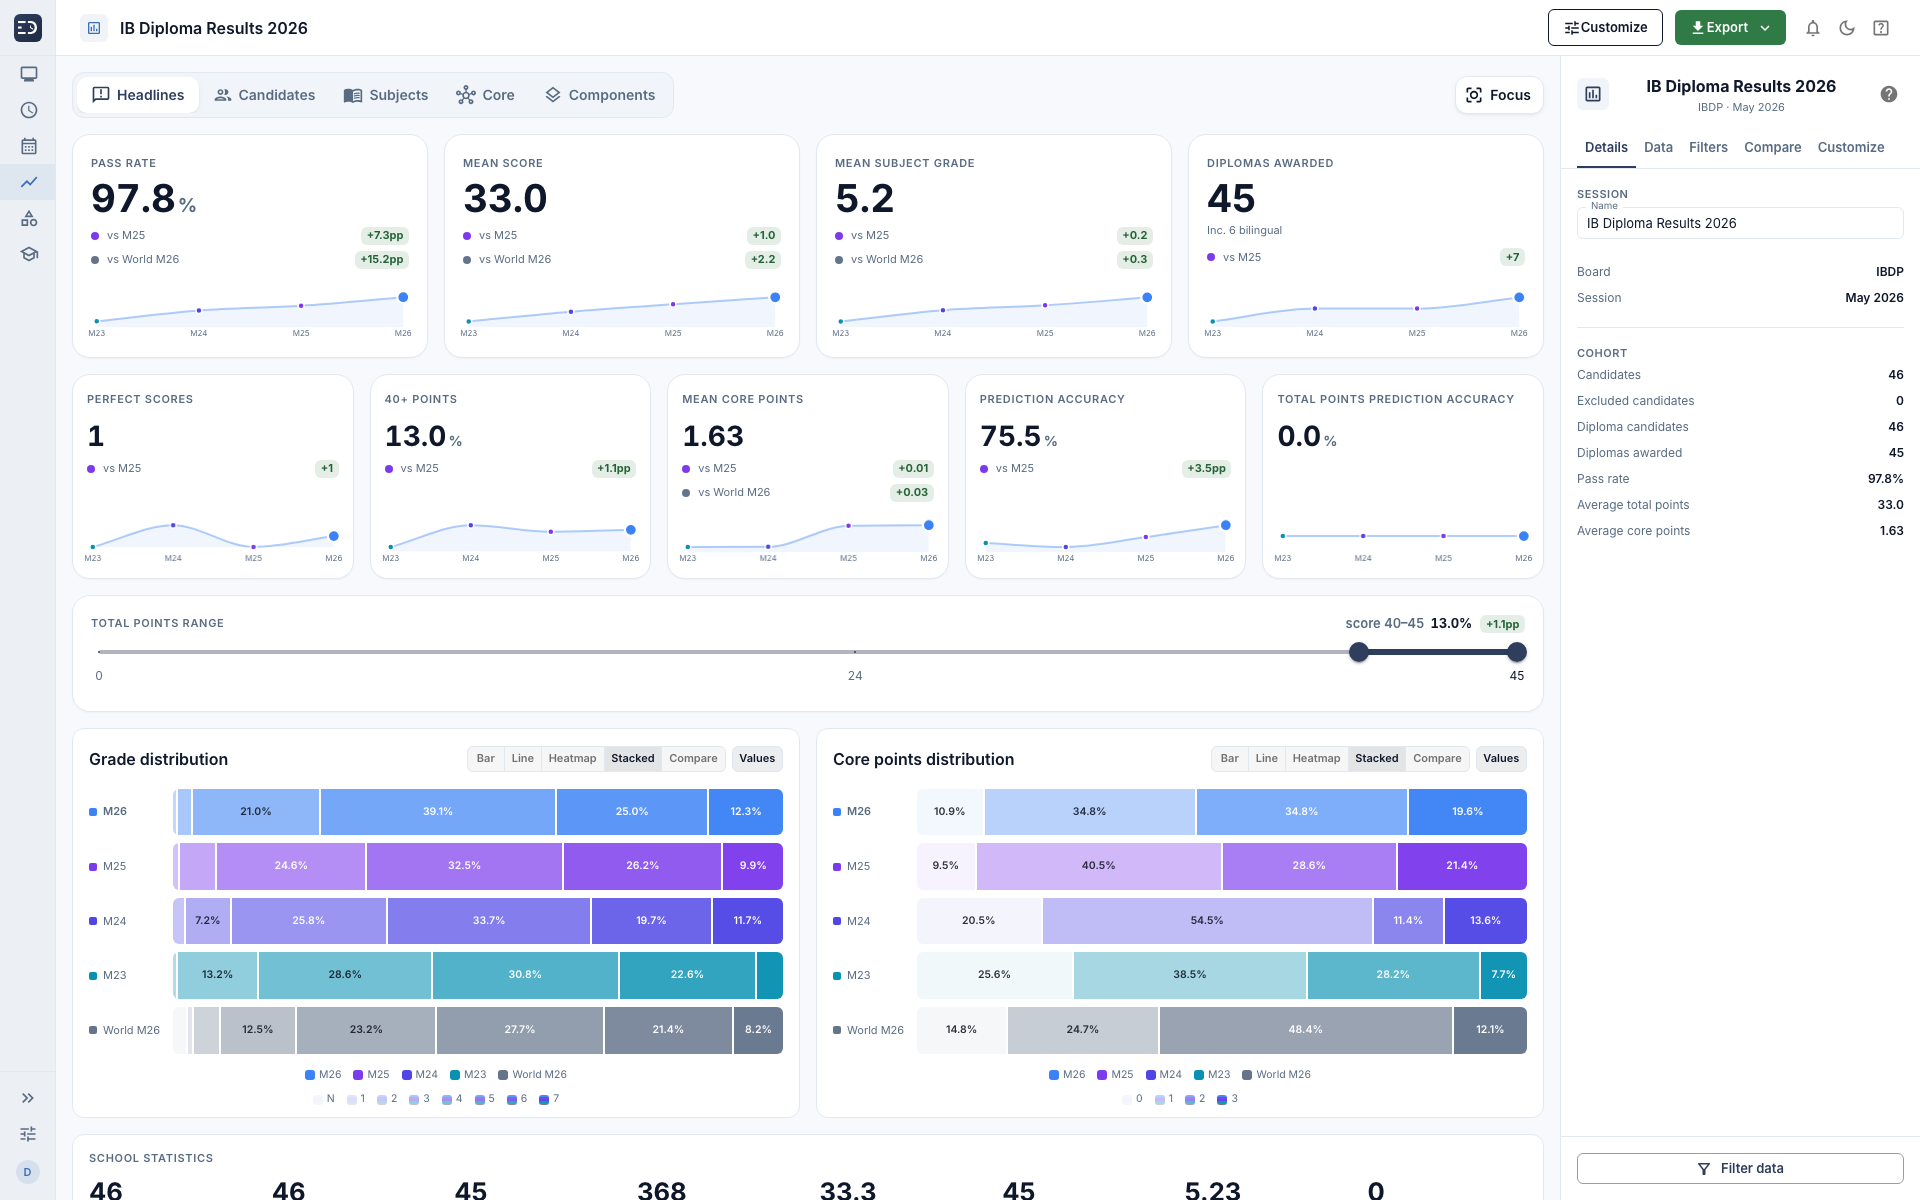
Every headline figure on one screen
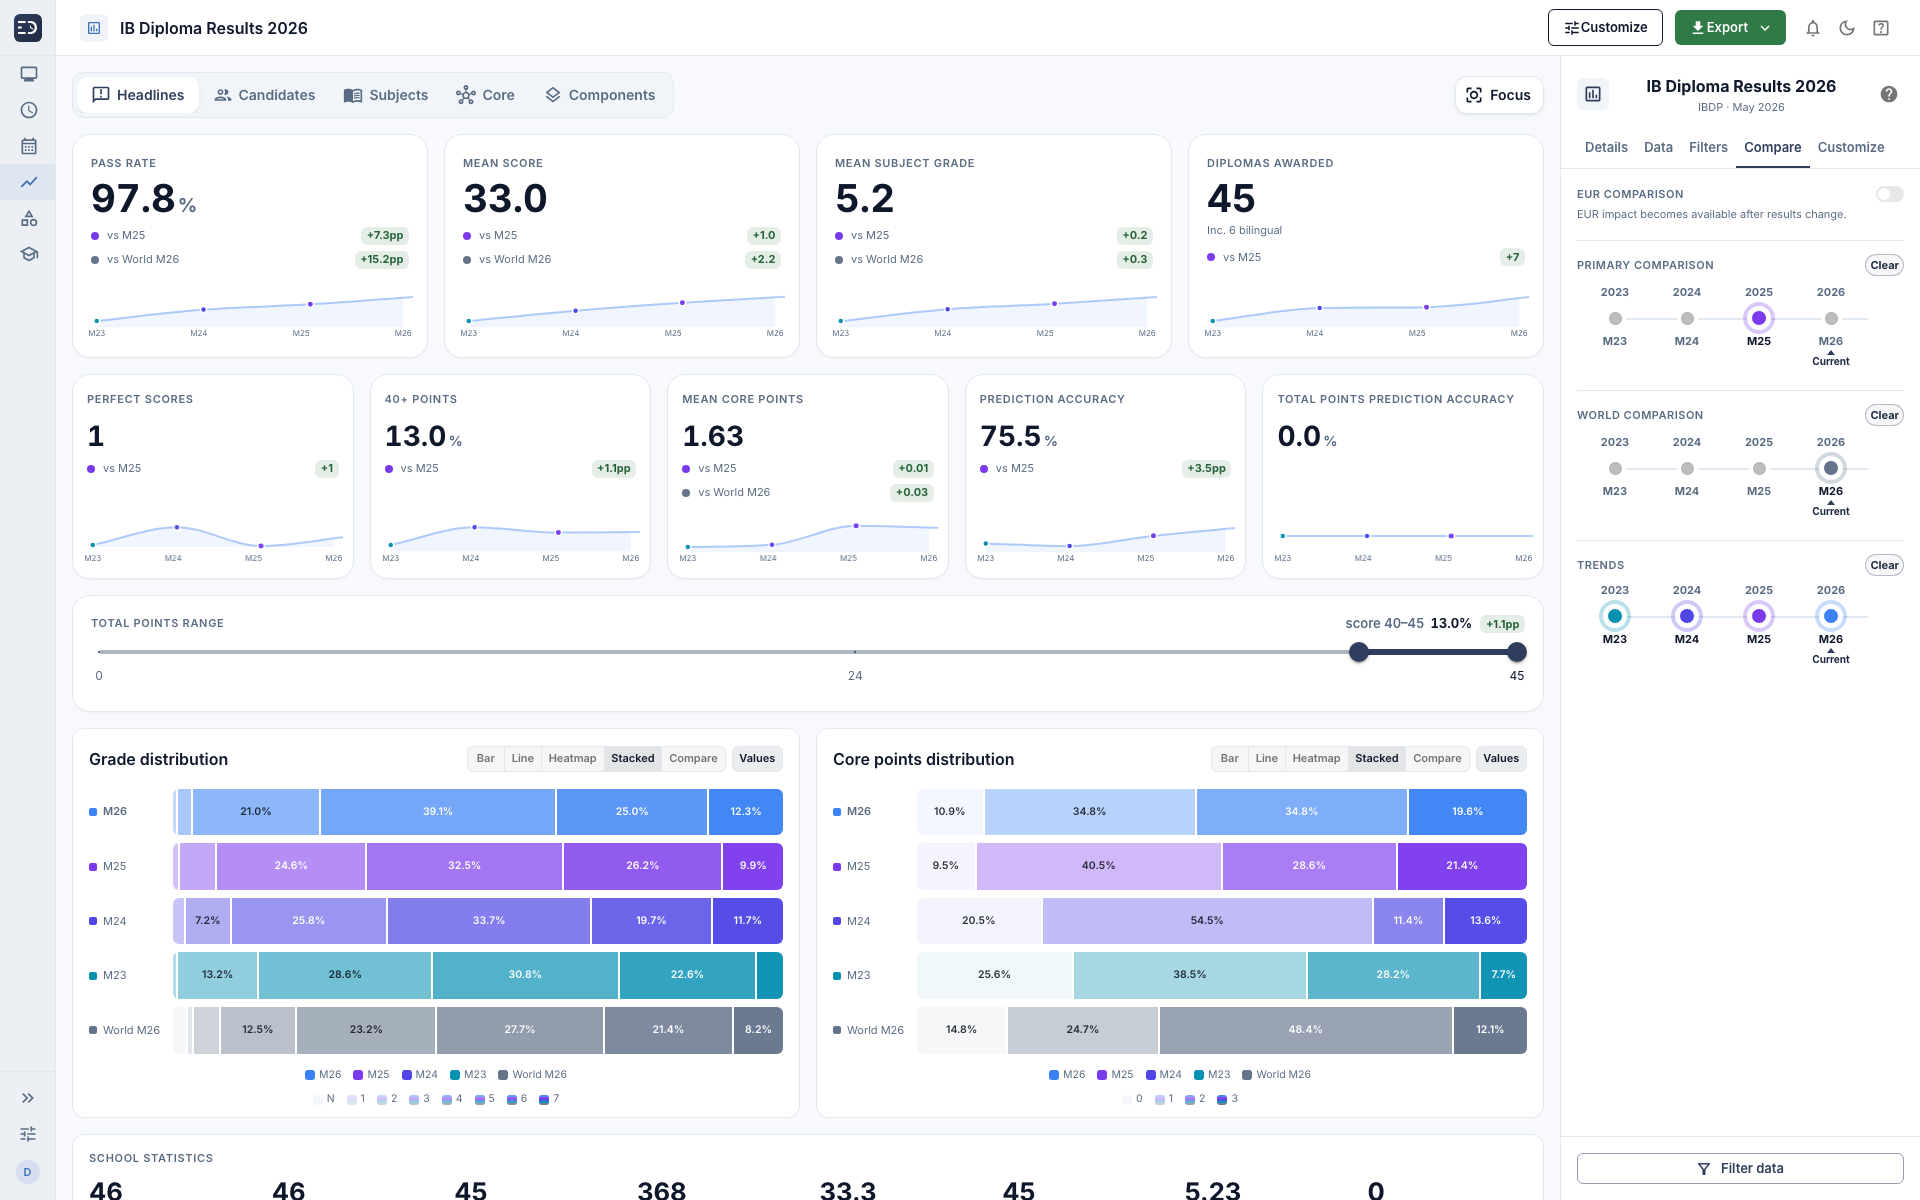
Pass rate, mean score, mean subject grade, diplomas awarded, 40+ scores, core points and prediction accuracy. The headlines your leadership team is likely to want first, on one screen ready to be shared instantly.
Distributions, not just averages
See the spread of grades and points behind the headline figures.
Your dashboard, your way
Personalize the headlines screen. Show, hide and reorder cards to suit your school's needs.
Presentation ready
Export charts and tables for reports, presentations and results meetings.
Overview
Focus
Analysis you won't find published anywhere else
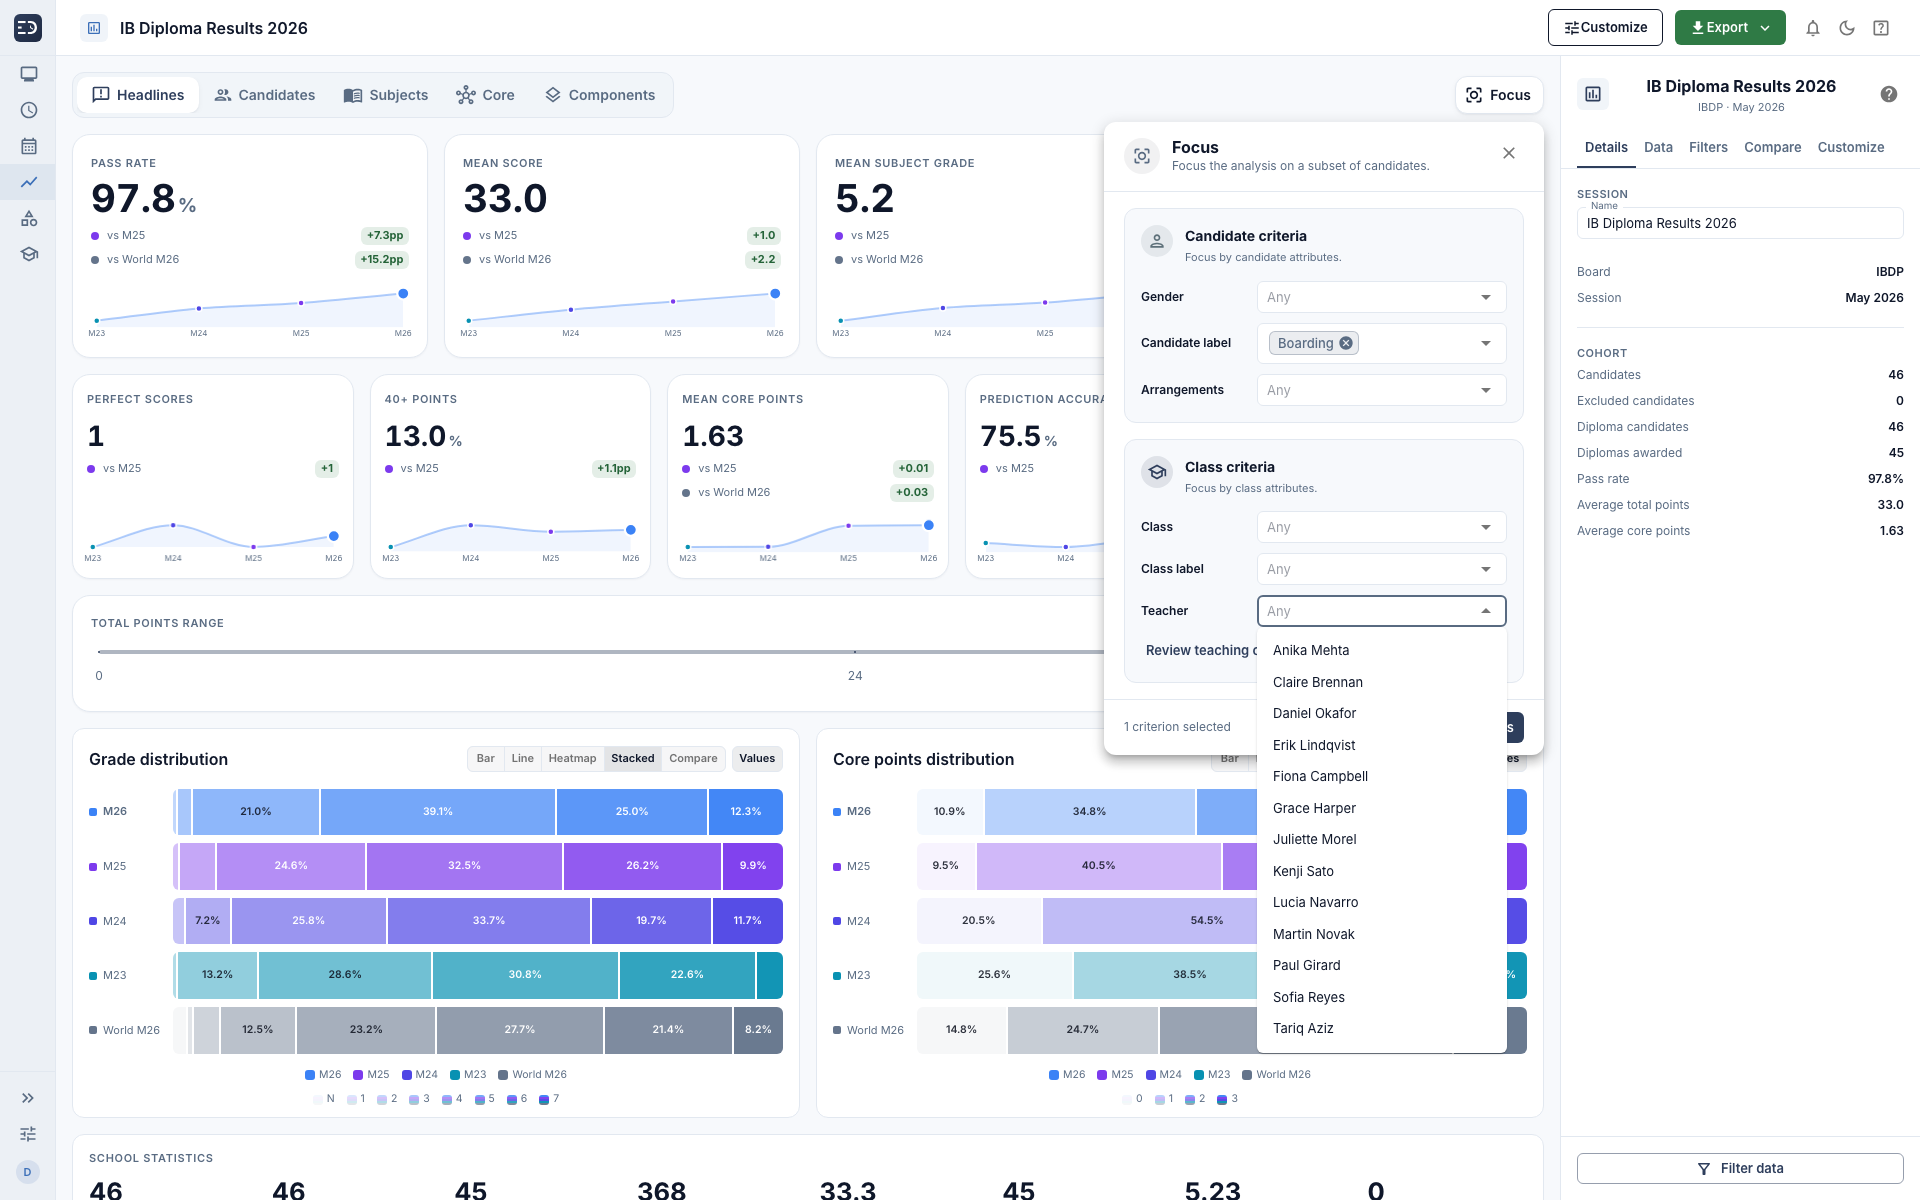
Focus in on the candidates you choose. Look at one class or one teacher's students, students with access arrangements, English language learners, boys or girls or scholarship holders. Analyser breaks down your results based on any of your school's groupings which other analyzing tools don't have access to.
By class, teacher or class label, using the classes already set up in ExamDisplay
By gender, access arrangement or any candidate label your school creates
Combine criteria and the whole dashboard recalculates for that group
Focus
Subject by subject
See how every subject is performing
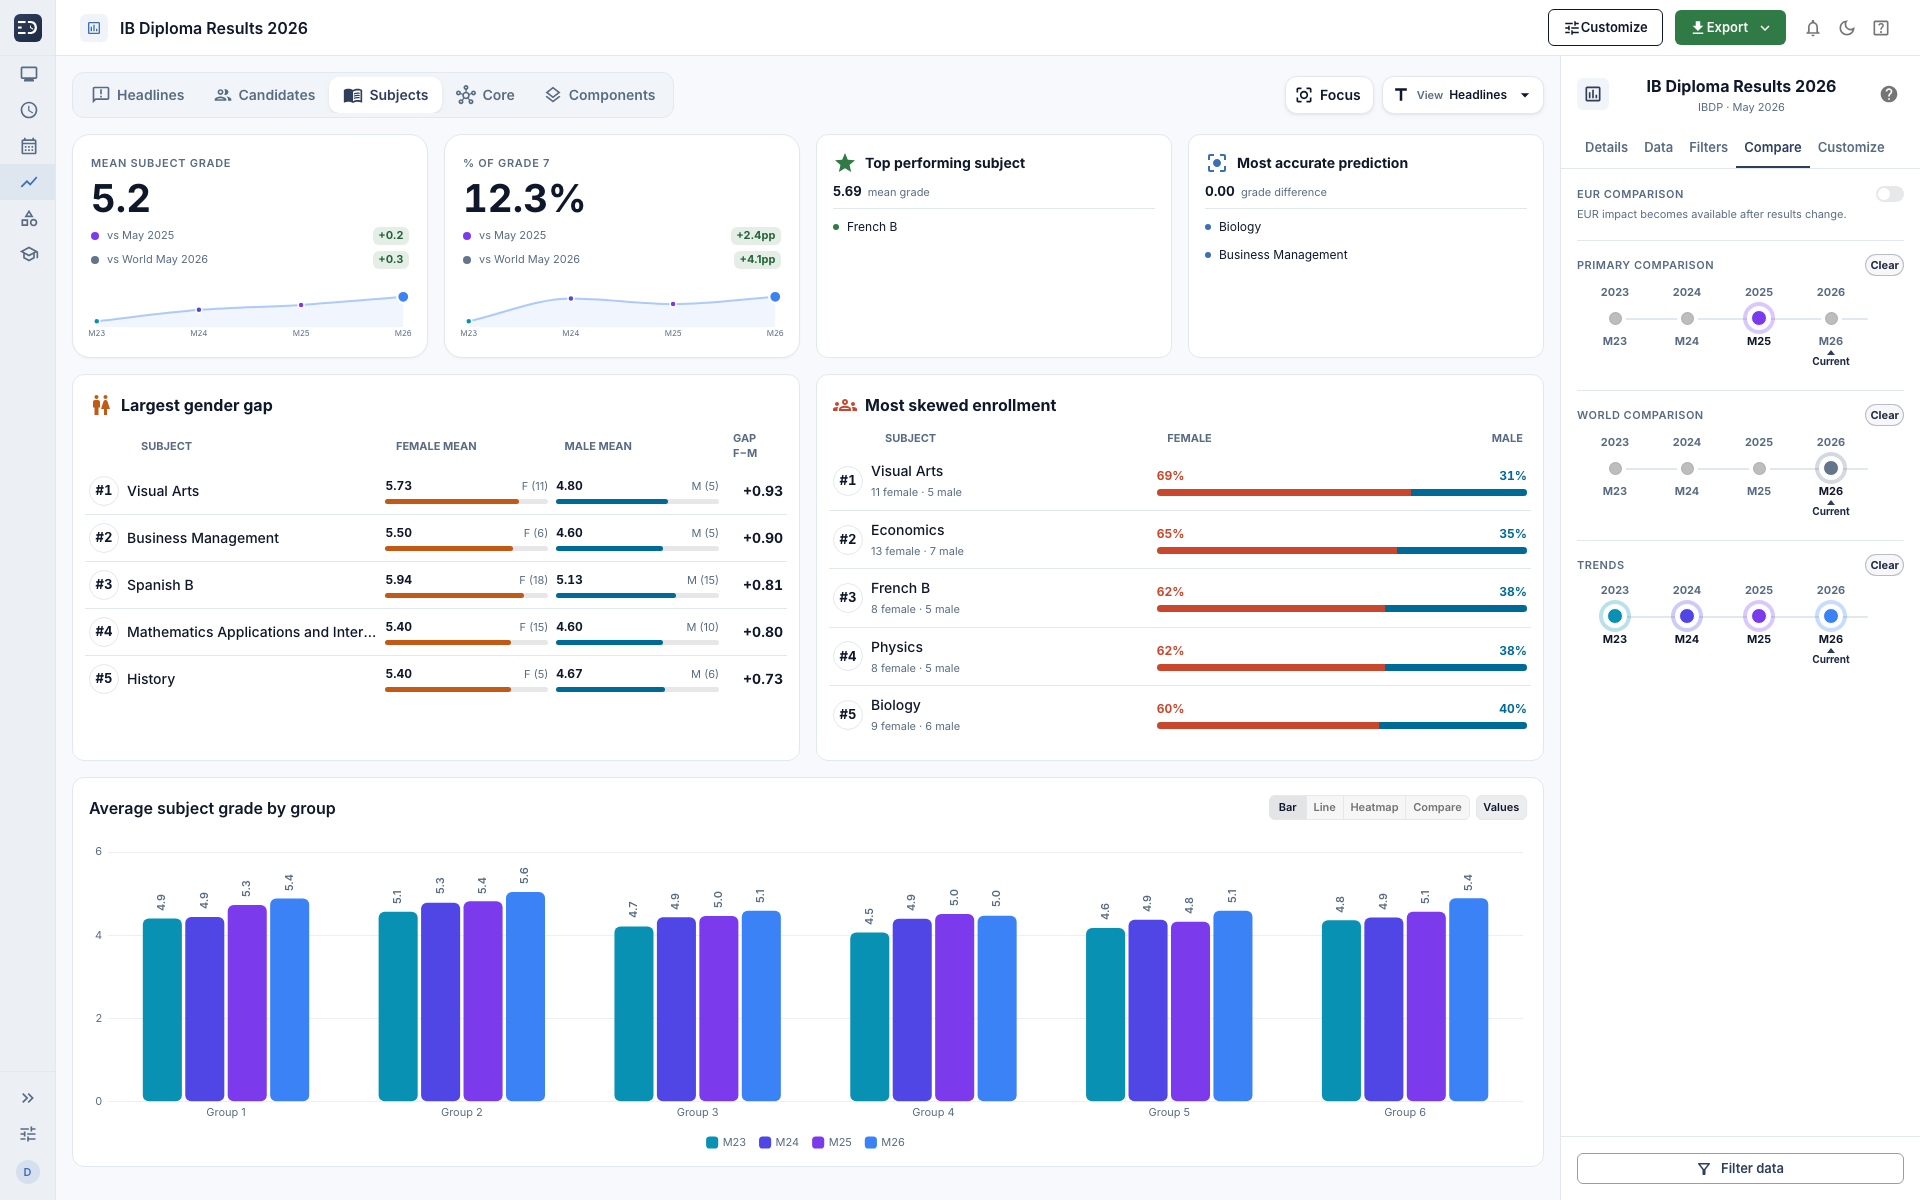
The subject overview picks out your strongest subject, the most accurate predictions, the largest gender gaps and the most uneven enrollments, then charts the average grade for each subject group across sessions. Department conversations start with evidence rather than impressions.
Share results easily with your teachers and department leads via PDF and CSV files.
Mean subject grade and share of 7s, compared with previous sessions and world figures
Gender gaps and uneven enrollment flagged by subject
Switch to the full subject table for every grade distribution and component
Compare achievement across components by average score and level
Subjects
The core
The Extended Essay and TOK, in detail
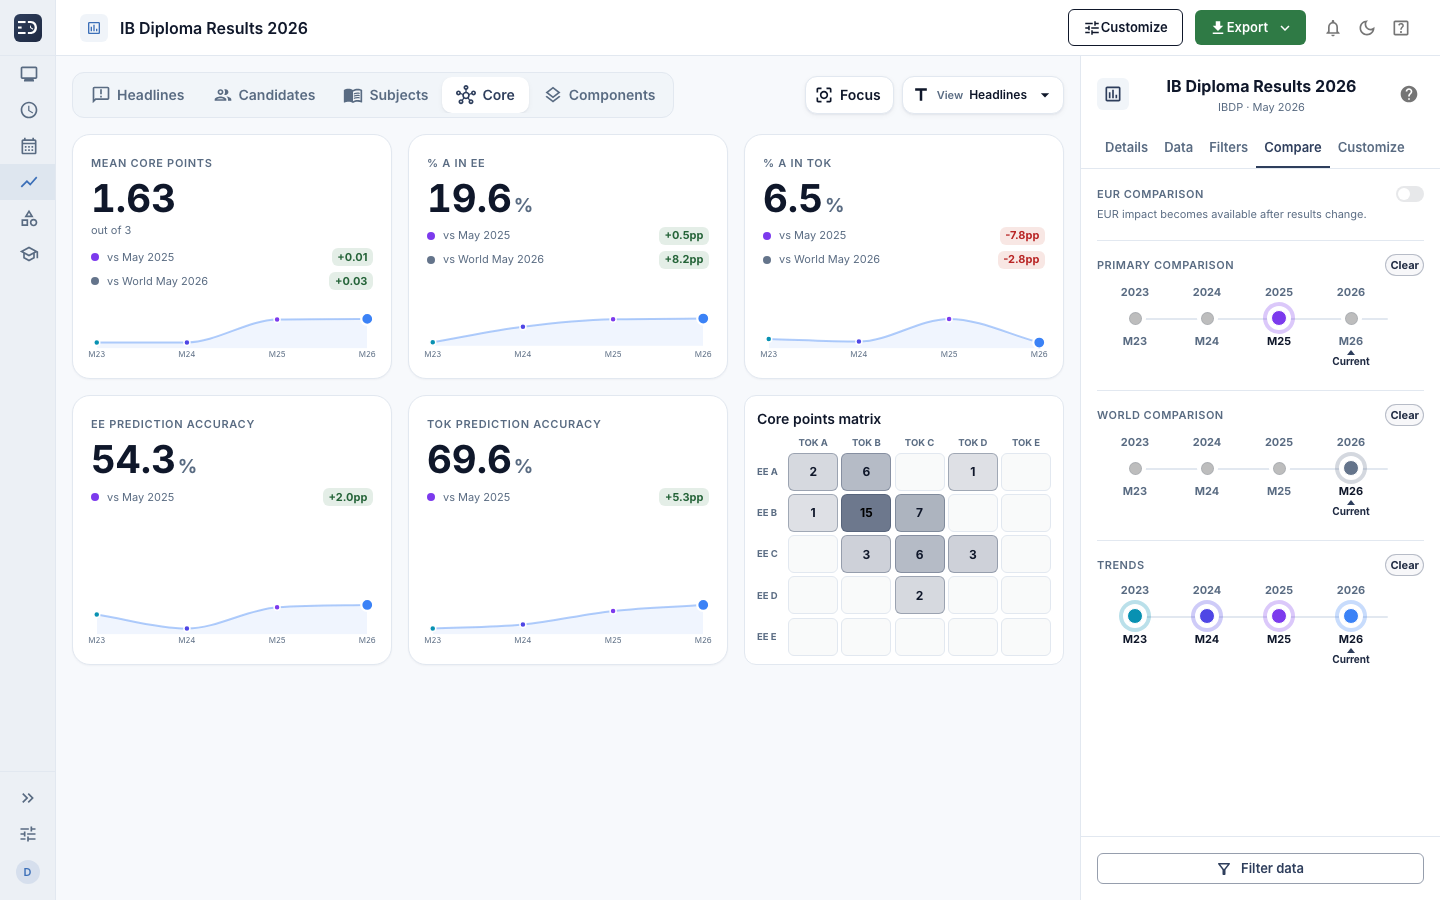
The core view shows mean core points, the share of A grades in the Extended Essay and Theory of Knowledge, and how accurate your EE and TOK predictions were. The core points matrix shows how many candidates received each grade combination, so you can see where points were gained and lost.
A grades and mean core points, compared with previous sessions and world figures
EE and TOK prediction accuracy, session by session
A core points matrix covering every EE and TOK grade combination
Core
Compare and track
Compare this session with previous years
Choose a previous session and the changes appear on every headline card, with earlier sessions overlaid on the charts. Import the IB statistical bulletin to see your results beside the world figures.
Session comparison
See this session alongside previous results on the same screen.
Trends over years
Three or more sessions plotted as a trend, not left to memory.
Compare
How it works
From results day to a briefing in three steps
- 1
Open the results files
Use the official IB results files exactly as issued.
- 2
Understand the cohort
Start with the headline figures, then explore subjects and individual candidates.
- 3
Share the story
Export the charts and tables your leadership team needs.
Explore your results with Analyser
Go from official results files to clear, useful analysis without rebuilding everything in spreadsheets.
Legal